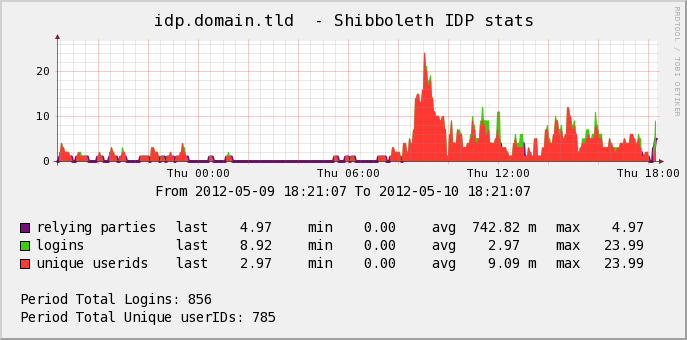
From the IdP Audit Log Analysis Tool, there's a contributed cacti graph template to draw on a graph the numbers of IDP logins, uniques userIds and relying Parties on a daily, weekly, monthly and yearly basis.
checkout http://docs.cacti.net/usertemplate:graph:shibboleth:idp_audit_log
screenshot